

AWS provides us a lavish free tier and generous developer credits. That made me kind of lax with any kind of budgeting. Whatever I do, I knew it would be covered. So I seldom cared for the costs.
My application is 100% serverless, and I was always within the free tier. So I just ignored it. But as my product got popular, and more users started visiting my website, I got a bill of $62. Not much, but I was worried about the rate of growth. I knew my application was not optimized for cost. That was never my priority. So the next target was to look into cost optimizations.
AWS Cost Explorer
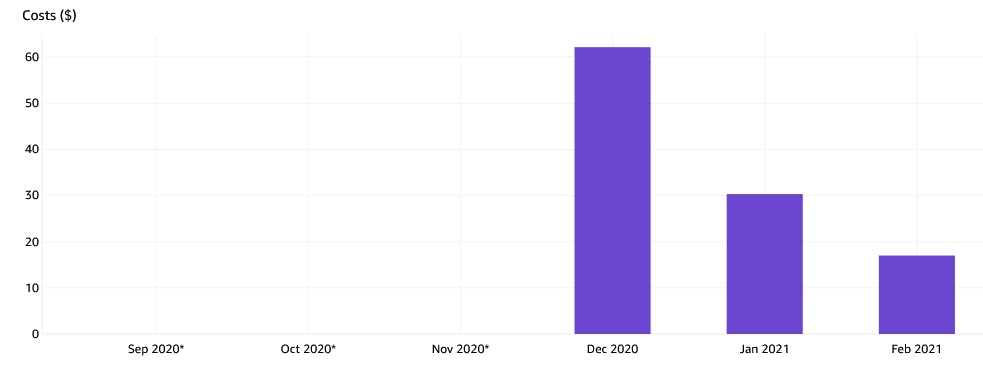
The AWS billing dashboard is good for paying bills etc. It shows a bar chart that is meant to predict the monthly bill. But it is not the best of their services. The monthly prediction is nowhere near the target. Best to ignore that.
But there is another service that provides very good detail and ability to forecast. That is the Cost Explorer. Apart from viewing the details on the AWS Console, we can also use the Cost Explorer programmatically, and extract a lot of meaningful insights. I loved it.
Using the cost explorer, I could identify the exact areas of improvement and fix them well before it could be costly. Thank you AWS once again!
On GUI Console
We can visit the UI Console of the cost explorer from the Billing Dashboard. You have to enable it first. That costs money. But I would suggest that you enable it before it is late. A stitch in time saves nine!
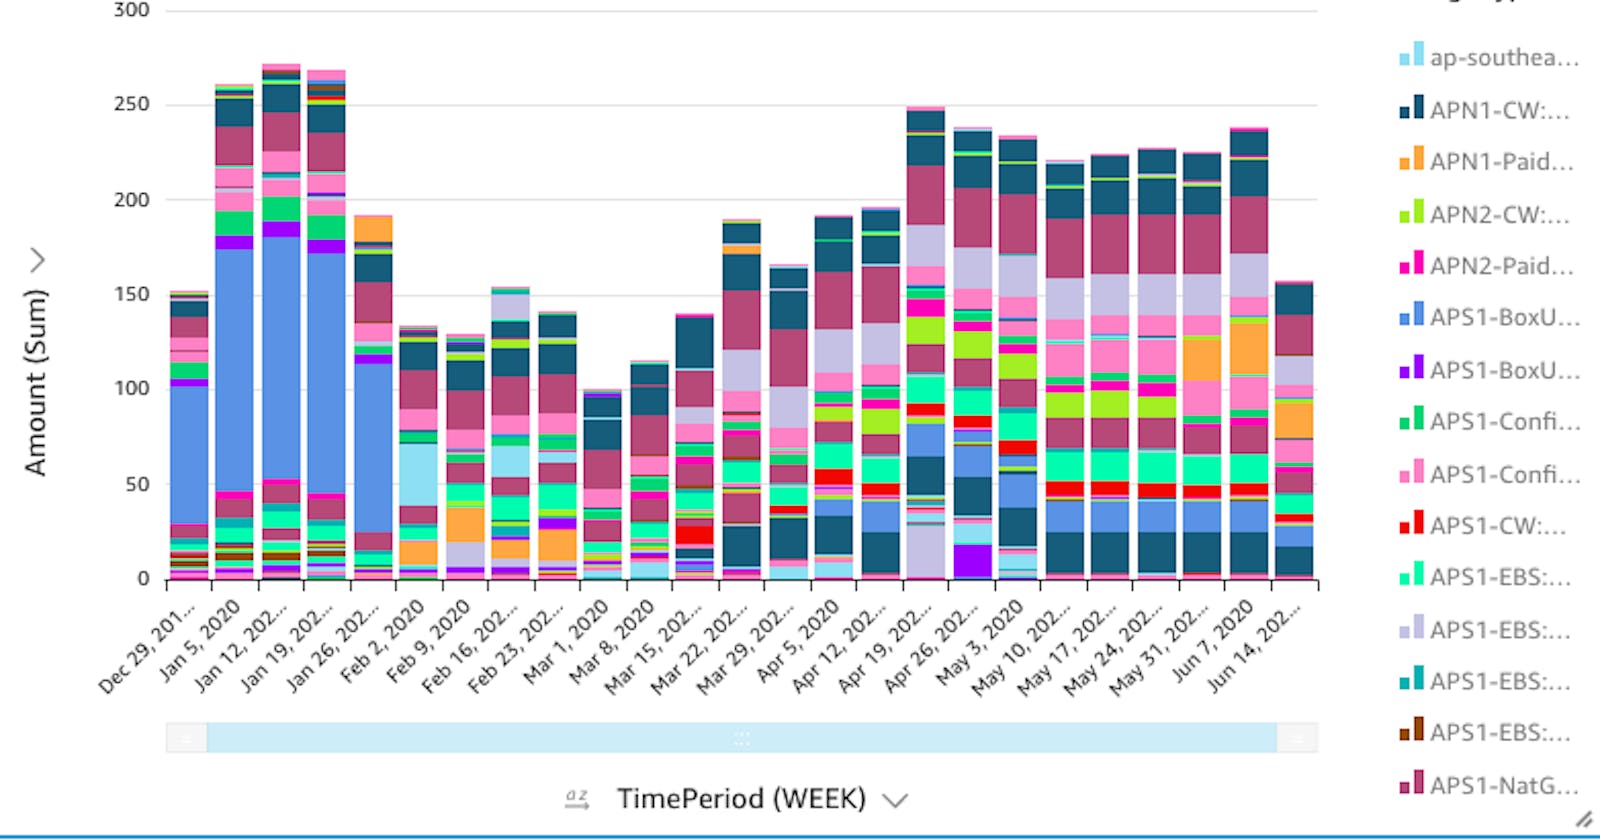
The UI is quite intuitive, and we can get detailed reports by day/service - grouped over time/region/service - and a lot more.
This is my graph over last few months.
Reports
With the reports section, we can pull out several custom reports. AWS provides us a good set of predefined report templates, will all the flexibility to define our own.
Budgets
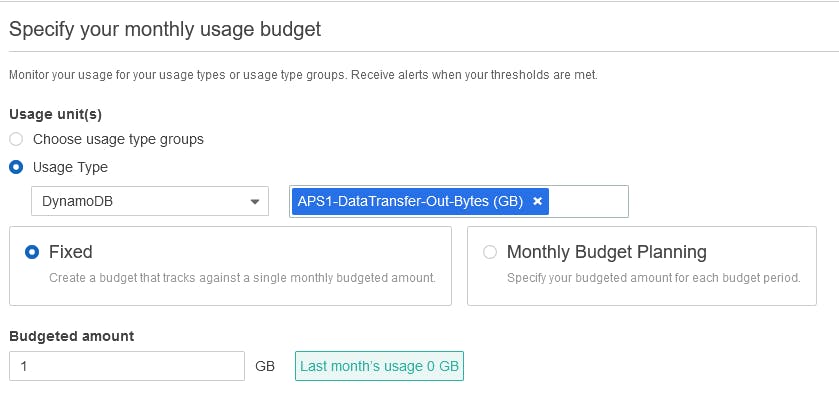
The cost explorer provides a lot more than this. We started learning AWS - with a simple budget, based on the cloud watch alarms. But, now we can do a lot more. We can define independent budgets (on cost and usage) for individual services, and also individual instances or operations of these services.
For example, a budget defined like this will track the outbound data usage from the DynamoDB. And alarm you if it is reaching the thresholds.
Anomaly Detection
This is important for steady systems, with a steady load. They help you make sure the expenditure is as per the plan. We can define different "monitors" that can track specific usages. It compares the current numbers with the historic values - to alarm you if something is violating the trends.
Cost Explorer API
The GUI console is OK - for an occasional scan. But we need something more than this. AWS provides us a wonderful API for this. The AWS Samples Github Repository provides us a good sample code for accessing the cost explorer API.
I made some tweaks to that code, to develop my own cost explorer report.
Lambda Function
import os
import sys
# Required to load modules from vendored subfolder (for clean development env)
sys.path.append(os.path.join(os.path.dirname(os.path.realpath(__file__)), "./vendored"))

import boto3
import datetime
import logging
import pandas as pd
#For date
from dateutil.relativedelta import relativedelta
#For email
from email.mime.application import MIMEApplication
from email.mime.multipart import MIMEMultipart
from email.mime.text import MIMEText
from email.utils import COMMASPACE, formatdate

SES_REGION="ap-south-1"

CURRENT_MONTH = True

#Default exclude support, as for Enterprise Support
#as support billing is finalised later in month so skews trends
INC_SUPPORT = os.environ.get('INC_SUPPORT')
if INC_SUPPORT == "true":
    INC_SUPPORT = True
else:
    INC_SUPPORT = False

TAG_VALUE_FILTER = os.environ.get('TAG_VALUE_FILTER') or '*'
TAG_KEY = os.environ.get('TAG_KEY')

class CostExplorer:
    """Retrieves BillingInfo checks from CostExplorer API
    >>> costexplorer = CostExplorer()
    >>> costexplorer.addReport(GroupBy=[{"Type": "DIMENSION","Key": "SERVICE"}])
    >>> costexplorer.generateExcel()
    """
    def __init__(self, CurrentMonth=False):
        #Array of reports ready to be output to Excel.
        self.reports = []
        self.client = boto3.client('ce', region_name='us-east-1')
        # self.end = datetime.date.today().replace(day=1)
        self.riend = datetime.date.today()
        self.end = self.riend

        # Default is last 12 months
        self.start = (datetime.date.today() - relativedelta(months=+12)).replace(day=1) #1st day of month 12 months ago

        self.ristart = (datetime.date.today() - relativedelta(months=+11)).replace(day=1) #1st day of month 11 months ago
        self.sixmonth = (datetime.date.today() - relativedelta(months=+6)).replace(day=1) #1st day of month 6 months ago, so RI util has savings values
        self.accounts = {}

    def addRiReport(self, Name='RICoverage', Savings=False, PaymentOption='PARTIAL_UPFRONT', Service='Amazon Elastic Compute Cloud - Compute'): #Call with Savings True to get Utilization report in dollar savings
        type = 'chart' #other option table
        if Name == "RICoverage":
            results = []
            response = self.client.get_reservation_coverage(
                TimePeriod={
                    'Start': self.ristart.isoformat(),
                    'End': self.riend.isoformat()
                },
                Granularity='MONTHLY'
            )
            results.extend(response['CoveragesByTime'])
            while 'nextToken' in response:
                nextToken = response['nextToken']
                response = self.client.get_reservation_coverage(
                    TimePeriod={
                        'Start': self.ristart.isoformat(),
                        'End': self.riend.isoformat()
                    },
                    Granularity='MONTHLY',
                    NextPageToken=nextToken
                )
                results.extend(response['CoveragesByTime'])
                if 'nextToken' in response:
                    nextToken = response['nextToken']
                else:
                    nextToken = False

            rows = []
            for v in results:
                row = {'date':v['TimePeriod']['Start']}
                row.update({'Coverage%':float(v['Total']['CoverageHours']['CoverageHoursPercentage'])})
                rows.append(row)

            df = pd.DataFrame(rows)
            df.set_index("date", inplace= True)
            df = df.fillna(0.0)
            df = df.T
        elif Name in ['RIUtilization','RIUtilizationSavings']:
            #Only Six month to support savings
            results = []
            response = self.client.get_reservation_utilization(
                TimePeriod={
                    'Start': self.sixmonth.isoformat(),
                    'End': self.riend.isoformat()
                },
                Granularity='MONTHLY'
            )
            results.extend(response['UtilizationsByTime'])
            while 'nextToken' in response:
                nextToken = response['nextToken']
                response = self.client.get_reservation_utilization(
                    TimePeriod={
                        'Start': self.sixmonth.isoformat(),
                        'End': self.riend.isoformat()
                    },
                    Granularity='MONTHLY',
                    NextPageToken=nextToken
                )
                results.extend(response['UtilizationsByTime'])
                if 'nextToken' in response:
                    nextToken = response['nextToken']
                else:
                    nextToken = False

            rows = []
            if results:
                for v in results:
                    row = {'date':v['TimePeriod']['Start']}
                    if Savings:
                        row.update({'Savings$':float(v['Total']['NetRISavings'])})
                    else:
                        row.update({'Utilization%':float(v['Total']['UtilizationPercentage'])})
                    rows.append(row)

                df = pd.DataFrame(rows)
                df.set_index("date", inplace= True)
                df = df.fillna(0.0)
                df = df.T
                type = 'chart'
            else:
                df = pd.DataFrame(rows)
                type = 'table' #Dont try chart empty result
        elif Name == 'RIRecommendation':
            results = []
            response = self.client.get_reservation_purchase_recommendation(
                #AccountId='string', May use for Linked view
                LookbackPeriodInDays='SIXTY_DAYS',
                TermInYears='ONE_YEAR',
                PaymentOption=PaymentOption,
                Service=Service
            )
            results.extend(response['Recommendations'])
            while 'nextToken' in response:
                nextToken = response['nextToken']
                response = self.client.get_reservation_purchase_recommendation(
                    #AccountId='string', May use for Linked view
                    LookbackPeriodInDays='SIXTY_DAYS',
                    TermInYears='ONE_YEAR',
                    PaymentOption=PaymentOption,
                    Service=Service,
                    NextPageToken=nextToken
                )
                results.extend(response['Recommendations'])
                if 'nextToken' in response:
                    nextToken = response['nextToken']
                else:
                    nextToken = False

            rows = []
            for i in results:
                for v in i['RecommendationDetails']:
                    row = v['InstanceDetails'][list(v['InstanceDetails'].keys())[0]]
                    row['Recommended']=v['RecommendedNumberOfInstancesToPurchase']
                    row['Minimum']=v['MinimumNumberOfInstancesUsedPerHour']
                    row['Maximum']=v['MaximumNumberOfInstancesUsedPerHour']
                    row['Savings']=v['EstimatedMonthlySavingsAmount']
                    row['OnDemand']=v['EstimatedMonthlyOnDemandCost']
                    row['BreakEvenIn']=v['EstimatedBreakEvenInMonths']
                    row['UpfrontCost']=v['UpfrontCost']
                    row['MonthlyCost']=v['RecurringStandardMonthlyCost']
                    rows.append(row)


            df = pd.DataFrame(rows)
            df = df.fillna(0.0)
            type = 'table' #Dont try chart this
        self.reports.append({'Name':Name,'Data':df, 'Type':type})


    def addReport(self, Name="Default",GroupBy=[{"Type": "DIMENSION","Key": "SERVICE"},],
    Style='Total', NoCredits=True, CreditsOnly=False, RefundOnly=False, UpfrontOnly=False, IncSupport=False):
        type = 'chart' #other option table
        results = []
        if not NoCredits:
            response = self.client.get_cost_and_usage(
                TimePeriod={
                    'Start': self.start.isoformat(),
                    'End': self.end.isoformat()
                },
                Granularity='MONTHLY',
                Metrics=[
                    'UnblendedCost',
                ],
                GroupBy=GroupBy
            )
        else:
            Filter = {"And": []}

            Dimensions={"Not": {"Dimensions": {"Key": "RECORD_TYPE","Values": ["Credit", "Refund", "Upfront", "Support"]}}}
            if INC_SUPPORT or IncSupport: #If global set for including support, we dont exclude it
                Dimensions={"Not": {"Dimensions": {"Key": "RECORD_TYPE","Values": ["Credit", "Refund", "Upfront"]}}}
            if CreditsOnly:
                Dimensions={"Dimensions": {"Key": "RECORD_TYPE","Values": ["Credit",]}}
            if RefundOnly:
                Dimensions={"Dimensions": {"Key": "RECORD_TYPE","Values": ["Refund",]}}
            if UpfrontOnly:
                Dimensions={"Dimensions": {"Key": "RECORD_TYPE","Values": ["Upfront",]}}

            tagValues = None
            if TAG_KEY:
                tagValues = self.client.get_tags(
                    SearchString=TAG_VALUE_FILTER,
                    TimePeriod = {
                        'Start': self.start.isoformat(),
                        'End': datetime.date.today().isoformat()
                    },
                    TagKey=TAG_KEY
                )

            if tagValues:
                Filter["And"].append(Dimensions)
                if len(tagValues["Tags"]) > 0:
                    Tags = {"Tags": {"Key": TAG_KEY, "Values": tagValues["Tags"]}}
                    Filter["And"].append(Tags)
            else:
                Filter = Dimensions.copy()

            response = self.client.get_cost_and_usage(
                TimePeriod={
                    'Start': self.start.isoformat(),
                    'End': self.end.isoformat()
                },
                Granularity='MONTHLY',
                Metrics=[
                    'UnblendedCost',
                ],
                GroupBy=GroupBy,
                Filter=Filter
            )

        if response:
            results.extend(response['ResultsByTime'])

            while 'nextToken' in response:
                nextToken = response['nextToken']
                response = self.client.get_cost_and_usage(
                    TimePeriod={
                        'Start': self.start.isoformat(),
                        'End': self.end.isoformat()
                    },
                    Granularity='MONTHLY',
                    Metrics=[
                        'UnblendedCost',
                    ],
                    GroupBy=GroupBy,
                    NextPageToken=nextToken
                )

                results.extend(response['ResultsByTime'])
                if 'nextToken' in response:
                    nextToken = response['nextToken']
                else:
                    nextToken = False
        rows = []
        sort = ''
        for v in results:
            row = {'date':v['TimePeriod']['Start']}
            sort = v['TimePeriod']['Start']
            for i in v['Groups']:
                key = i['Keys'][0]
                if key in self.accounts:
                    key = self.accounts[key][ACCOUNT_LABEL]
                row.update({key:float(i['Metrics']['UnblendedCost']['Amount'])})
            if not v['Groups']:
                row.update({'Total':float(v['Total']['UnblendedCost']['Amount'])})
            rows.append(row)

        df = pd.DataFrame(rows)
        df.set_index("date", inplace= True)
        df = df.fillna(0.0)

        if Style == 'Change':
            dfc = df.copy()
            lastindex = None
            for index, row in df.iterrows():
                if lastindex:
                    for i in row.index:
                        try:
                            df.at[index,i] = dfc.at[index,i] - dfc.at[lastindex,i]
                        except:
                            logging.exception("Error")
                            df.at[index,i] = 0
                lastindex = index
        df = df.T
        df = df.sort_values(sort, ascending=False)
        self.reports.append({'Name':Name,'Data':df, 'Type':type})


    def generateExcel(self):
        # Create a Pandas Excel writer using XlsxWriter as the engine.\
        os.chdir('/tmp')
        writer = pd.ExcelWriter('cost_explorer_report.xlsx', engine='xlsxwriter')
        workbook = writer.book
        for report in self.reports:
            print(report['Name'],report['Type'])
            report['Data'].to_excel(writer, sheet_name=report['Name'])
            worksheet = writer.sheets[report['Name']]
            if report['Type'] == 'chart':

                # Create a chart object.
                chart = workbook.add_chart({'type': 'column', 'subtype': 'stacked'})


                chartend=13
                for row_num in range(1, len(report['Data']) + 1):
                    chart.add_series({
                        'name':       [report['Name'], row_num, 0],
                        'categories': [report['Name'], 0, 1, 0, chartend],
                        'values':     [report['Name'], row_num, 1, row_num, chartend],
                    })
                chart.set_y_axis({'label_position': 'low'})
                chart.set_x_axis({'label_position': 'low'})
                worksheet.insert_chart('O2', chart, {'x_scale': 2.0, 'y_scale': 2.0})
        writer.save()

        #Time to deliver the file to S3
        if os.environ.get('S3_BUCKET'):
            s3 = boto3.client('s3')
            s3.upload_file("cost_explorer_report.xlsx", os.environ.get('S3_BUCKET'), "cost_explorer_report.xlsx")
        if os.environ.get('SES_SEND'):
            #Email logic
            msg = MIMEMultipart()
            msg['From'] = os.environ.get('SES_FROM')
            msg['To'] = COMMASPACE.join(os.environ.get('SES_SEND').split(","))
            msg['Date'] = formatdate(localtime=True)
            msg['Subject'] = "Cost Explorer Report"
            text = "Find your Cost Explorer report attached\n\n"
            msg.attach(MIMEText(text))
            with open("cost_explorer_report.xlsx", "rb") as fil:
                part = MIMEApplication(
                    fil.read(),
                    Name="cost_explorer_report.xlsx"
                )
            part['Content-Disposition'] = 'attachment; filename="%s"' % "cost_explorer_report.xlsx"
            msg.attach(part)
            #SES Sending
            ses = boto3.client('ses', region_name=SES_REGION)
            result = ses.send_raw_email(
                Source=msg['From'],
                Destinations=os.environ.get('SES_SEND').split(","),
                RawMessage={'Data': msg.as_string()}
            )


def lambda_handler(event, context):
    costexplorer = CostExplorer(CurrentMonth=False)
    #Default addReport has filter to remove Support / Credits / Refunds / UpfrontRI
    #Overall Billing Reports
    costexplorer.addReport(Name="Total", GroupBy=[],Style='Total',IncSupport=True)
    costexplorer.addReport(Name="TotalChange", GroupBy=[],Style='Change')
    costexplorer.addReport(Name="TotalInclCredits", GroupBy=[],Style='Total',NoCredits=False,IncSupport=True)
    costexplorer.addReport(Name="TotalInclCreditsChange", GroupBy=[],Style='Change',NoCredits=False)
    costexplorer.addReport(Name="Credits", GroupBy=[],Style='Total',CreditsOnly=True)
    costexplorer.addReport(Name="Refunds", GroupBy=[],Style='Total',RefundOnly=True)
    costexplorer.addReport(Name="RIUpfront", GroupBy=[],Style='Total',UpfrontOnly=True)
    #GroupBy Reports
    costexplorer.addReport(Name="Services", GroupBy=[{"Type": "DIMENSION","Key": "SERVICE"}],Style='Total',IncSupport=True)
    costexplorer.addReport(Name="ServicesChange", GroupBy=[{"Type": "DIMENSION","Key": "SERVICE"}],Style='Change')
    costexplorer.addReport(Name="Accounts", GroupBy=[{"Type": "DIMENSION","Key": "LINKED_ACCOUNT"}],Style='Total')
    costexplorer.addReport(Name="AccountsChange", GroupBy=[{"Type": "DIMENSION","Key": "LINKED_ACCOUNT"}],Style='Change')
    costexplorer.addReport(Name="Regions", GroupBy=[{"Type": "DIMENSION","Key": "REGION"}],Style='Total')
    costexplorer.addReport(Name="RegionsChange", GroupBy=[{"Type": "DIMENSION","Key": "REGION"}],Style='Change')
    if os.environ.get('COST_TAGS'): #Support for multiple/different Cost Allocation tags
        for tagkey in os.environ.get('COST_TAGS').split(','):
            tabname = tagkey.replace(":",".") #Remove special chars from Excel tabname
            costexplorer.addReport(Name="{}".format(tabname)[:31], GroupBy=[{"Type": "TAG","Key": tagkey}],Style='Total')
            costexplorer.addReport(Name="Change-{}".format(tabname)[:31], GroupBy=[{"Type": "TAG","Key": tagkey}],Style='Change')
    #RI Reports
    costexplorer.addRiReport(Name="RICoverage")
    costexplorer.addRiReport(Name="RIUtilization")
    costexplorer.addRiReport(Name="RIUtilizationSavings", Savings=True)
    costexplorer.addRiReport(Name="RIRecommendation") #Service supported value(s): Amazon Elastic Compute Cloud - Compute, Amazon Relational Database Service
    costexplorer.generateExcel()
    return "Report Generated"
IAM Role
To run this, the Lambda permission requires a role with the following permissions:
Basic Lambda Policy
{
    "Version": "2012-10-17",
    "Statement": [
        {
            "Effect": "Allow",
            "Action": [
                "logs:CreateLogGroup",
                "logs:CreateLogStream",
                "logs:PutLogEvents"
            ],
            "Resource": "*"
        }
    ]
}
S3 Bucket to save Reports
{
    "Version": "2012-10-17",
    "Statement": [
        {
            "Sid": "VisualEditor0",
            "Effect": "Allow",
            "Action": [
                "s3:PutObject",
                "s3:GetObject"
            ],
            "Resource": "arn:aws:s3:::account.admin/*"
        }
    ]
}
SES
{
    "Version": "2012-10-17",
    "Statement": [
        {
            "Sid": "VisualEditor0",
            "Effect": "Allow",
            "Action": [
                "ses:SendEmail",
                "ses:SendRawEmail"
            ],
            "Resource": "*"
        }
    ]
}
Cost Explorer
{
    "Version": "2012-10-17",
    "Statement": [
        {
            "Sid": "VisualEditor0",
            "Effect": "Allow",
            "Action": "ce:*",
            "Resource": "*"
        }
    ]
}
Event Bridge Trigger
Finally, we setup a trigger on Event Bridge to run this Lambda function on 5th of every month. This generates an email, with an XLS report attached. We can set it up for weeks or even days - if we want frequent updates.